COLLEGE GOLF Data Unveils: Roster Strategies, Freshman Odds, and Most Common Name in College Golf🧐
Mikkelgolf.com Newsletter #11
On a whim, I crunched the numbers from the NCAA Men’s Division 1 Spikemark rankings as of March 1st, 2024. My goal was to find a correlation to success in the college rankings. The parameters are a bit limited, but some very interesting insights emerged! Along the way, I also found some unproductive “fun-facts.” A few of the questions answered were: 1) Does academic year correlate with player rankings in college golf? 2) How do top-ranked teams build their rosters? 3) What’s the most common first name on men’s golf rosters?
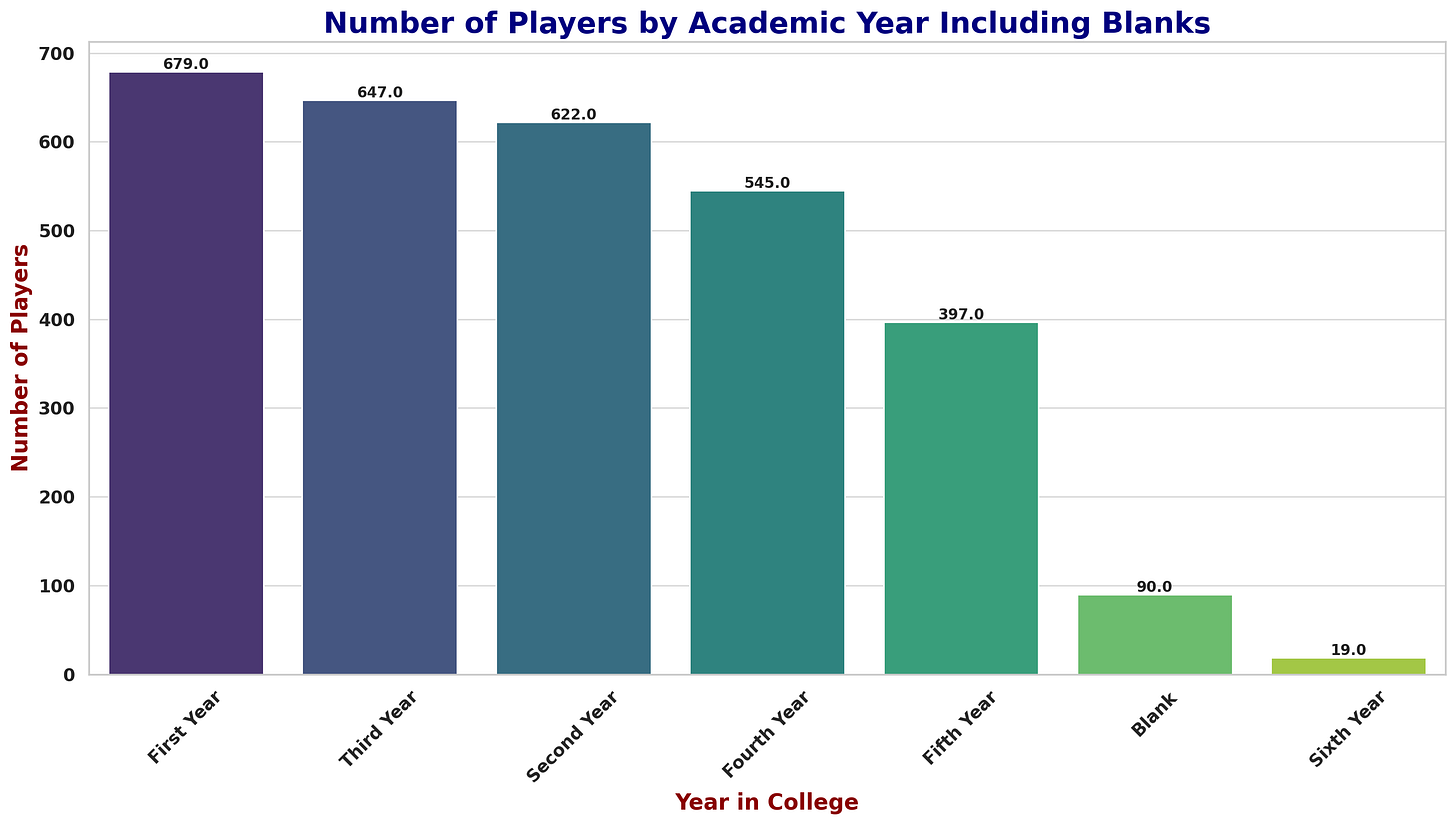
According to Spikemark’s player directory, there are 2,999 players on NCAA Men’s Division 1 Golf rosters this year (2023-2024 season). Here’s how the players break down by class:
How to read this chart: There are 679 athletes tagged as “First Year” on Men’s Division 1 rosters this year. This is the biggest class, followed by 647 athletes in their Third Year, and so forth. There are 19 sixth-year players in division one.
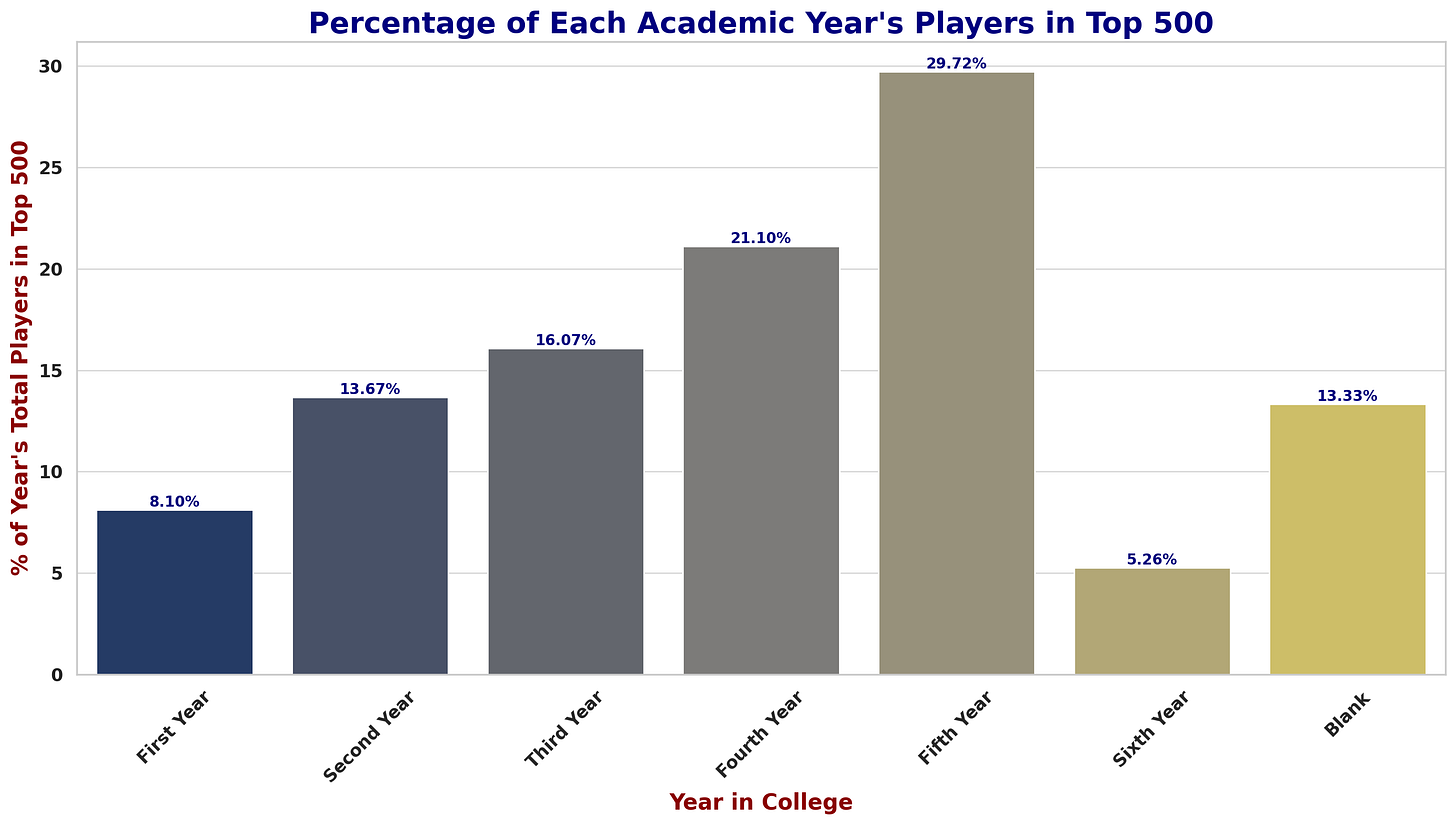
Is there a link between seniority and success on the golf course? In the wake of COVID-19, the landscape of college golf has seen a significant increase in fifth-year seniors. This surge of extra years is due to the additional year of eligibility granted to athletes from the 2019-2020 season. More fifth-year athletes combined with the evolving dynamics of the transfer portal, the question arises for coaches on how to optimize their recruiting strategies. Does the seasoned wisdom of fifth-year players outweigh the fresh potential of incoming freshmen? And how are the top college coaches actually building their rosters? In an effort to answer these questions, let’s first look at what percentage of players from each Academic Year are ranked. Below are the charts for share of players ranked in the top-500, top-100, and top-50:
How to read these charts: Currently, 0.9% of Freshmen (First Year) golfers are ranked in the top-100 (middle chart). Roughly, a Freshman has a 1% chance of being ranked in the top 100. The probability increases year-over-year. 6.5% of fifth-year players are currently ranked in the top-100.
The likelihood of being ranked in the top-500, top-100, or top-50 progressively increases with each passing year, with the sole exception being sixth-year players. This trend may not come as a shock, considering older athletes benefit from additional years of training and competitive experience. Specifically, as a fifth-year player, the odds of being ranked dramatically surpass the general average. With 2,999 division one players this year, a random athlete's chances of making it into the rankings stand at 16.67% for the top-500, 3.33% for the top-100, and 1.67% for the top-50. In contrast, a fifth-year player boasts a 29.72% chance of landing in the top-500, 6.5% in the top-100, and 2.77% in the top-50. Almost doubling the probability at every cut-off.
What if we compare Freshmen to Fifth-year Seniors? Let’s say you hypothetically see a player on the range. You can’t quite make out their uniform, but you somehow know what year they are in school. In this scenario, we find that the Fifth-year Senior you spotted on the range is roughly three times more likely to be ranked in the top-500, seven times more likely to be ranked in the top-100, and five times more likely to be ranked in the top-50 than the Freshman.
At the midway point in this season, a Fifth-year Senior is roughly seven times more likely to be ranked in the top-100 than a Freshman.
It’s undeniable that the likelihood of being ranked increases for each passing year. However, one thing to keep in mind regarding Fifth-year Seniors is there’s a natural attrition for this academic year. What I mean is that players who aren’t competitive players during their third and forth years will likely elect not to come back for their fifth year. The better players who contribute positively to their respective team scores are more likely to be encouraged by their Coach to return for their fifth year. The fifth-year population has therefore seen some attrition. Attrition mostly from the back-end. The non-ranked players.
SCHOOLS WITH THE MOST RANKED PLAYERS
Vanderbilt University, University of North Carolina, and Auburn University are leading with the highest number of players in the top 50, each having 3 players.
When expanding the criteria to the top 100, Vanderbilt University and University of North Carolina maintain their lead with 4 players each, followed closely by several other schools.
Looking at the top 500, Arizona State University emerges with the most players, totaling 10, indicating a broader representation in the rankings.
All of these teams are currently ranked in the top-6. Unsurprisingly, the top teams in college golf have a number of highly-ranked individual players.
TOP-RANKED ROSTERS
So far, we’ve seen how seniority increases the likelihood of being ranked at the top-500, top-100, and top-50 levels with each passing year. We’ve also seen how the very best teams naturally have a number of highly ranked players. Now, let’s see if we can answer the question of how top coaches are piecing together their rosters? Do they know about the advantage of experience?
Let’s look at all players per academic year and compare them to players on top-25 rosters:
So if you are a Fifth-year Senior on a top-25 roster, you have a 76% chance of being ranked in the top-500. Not surprisingly, more players from top-25 rosters are ranked in the top-500 than the overall average in college golf for every academic year. Note the big jump in percentage from First Year athletes to Second Year athletes for top-25 schools. A portion of that big jump could be explained by Freshmen redshirting (not competing).
What about the top-100 and top-50?
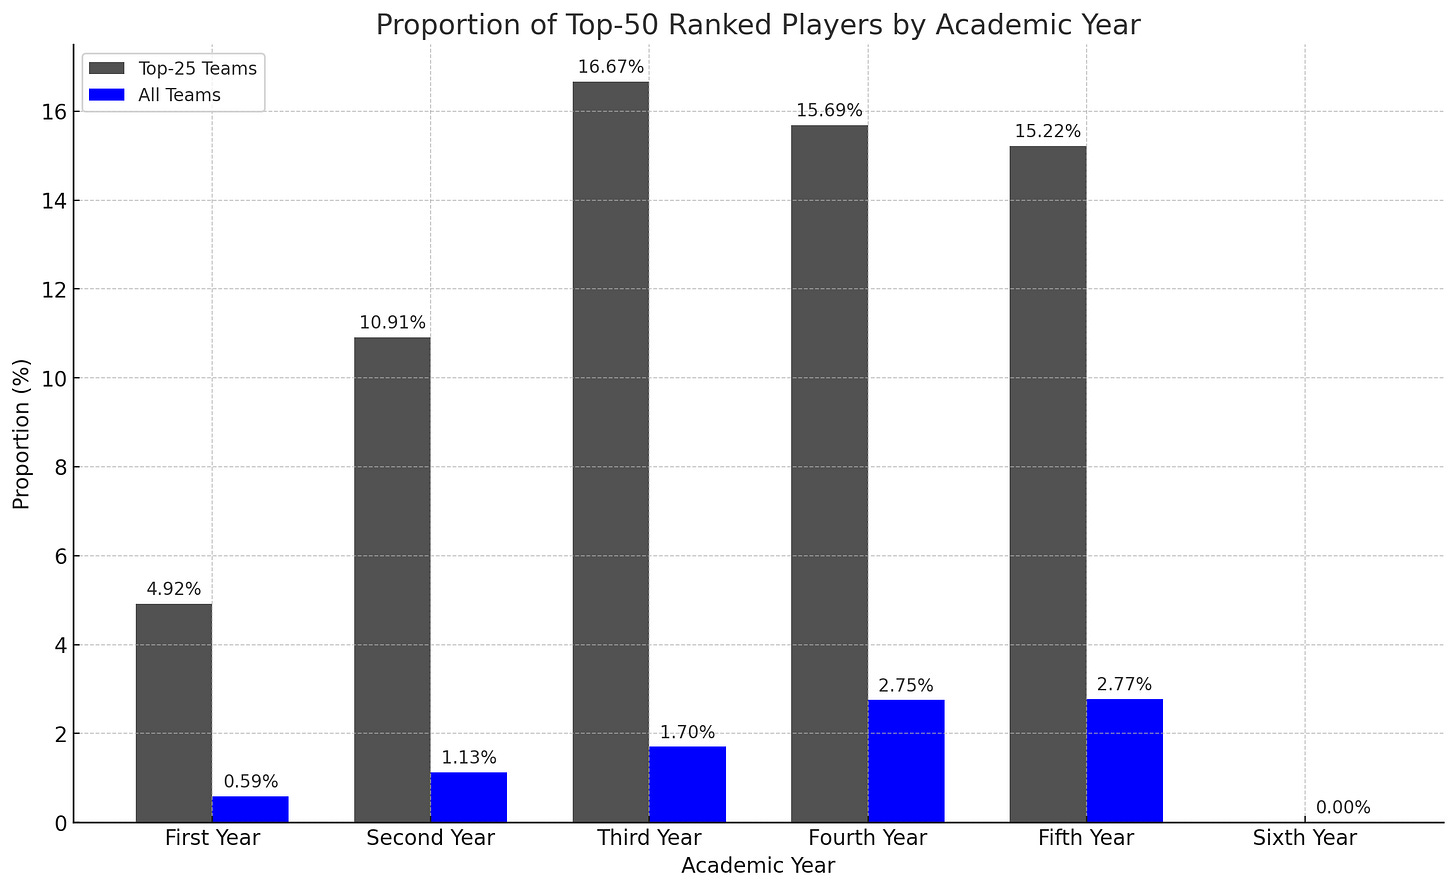
Let’s include top-65 teams as well to the charts below. Top-65 are approximately the teams that will qualify for the NCAA post-season.
Observing the academic year's positive influence on ranking probabilities across all team categories is fascinating. The only exception occurs within the top-50 individual rankings, where top-25 teams exhibit a marginally higher proportion of Third and Fourth Year athletes ranked above Fifth-years. Similarly, on top-65 teams, Fourth Year athletes hold a slight probability-advantage over Fifth-years in ranking in the top-50. The way I see it, this phenomenon likely stems from two key factors. Firstly, the top-50 represents a more exclusive group, introducing a higher degree of variability in athlete distribution by academic year. Secondly, within this elite subset, certain top-50 ranked players stand out as outliers. These individuals perform at an All-American level, distinguishing themselves as the elite of college golf. A few possess extraordinary talents that set them apart, making their skill, rather than the experience accumulated over years in college golf, the primary driver of their success.
STOCKING UP ON EXPERIENCE?
Regarding roster sizes, the teams in division one men’s golf range from 5 to 18. The team with the most amount of players is Bryant University, with a total of 18 players. On the other hand, the team with the fewest amount of players is University of Wisconsin-Green Bay, with only 5 players. The average number of players on a team, regardless of academic year, for each team category is as follows:
All Teams: On average, there are approximately 9.80 players per team across all teams in the dataset.
Top-65 Ranked Teams: On average, there are approximately 10.31 players per team among the top-65 ranked teams.
Top-25 Ranked Teams: On average, there are approximately 11.12 players per team among the top-25 ranked teams.
This analysis reveals that, on average, higher-ranked teams (especially those in the top-25) tend to have a larger roster of players compared to the broader set of teams. This could indicate a trend where more successful or higher-ranked teams maintain larger squads, possibly to ensure depth in talent and more options for team selection.
Let’s look at the breakdown by academic year and team ranking. The first graph is percentage of roster by academic year. The second graph shows us amount of players by academic year.
We can see that the top-25 ranked teams carry more players in each academic year. However, the largest percentage increase on top teams’ rosters is clearly fourth- and fifth-year players. We’ve seen that top-25 teams carry on average 1.32 more players than the typical college golf team. There are a handful of players with missing academic year data, which gives us 1.24 players we can account for on academic year-level. These 1.24 players are made up of:
0.22 First Year Athletes (17.7%)
0.17 Second Year Athletes (13.7%)
0.05 Third Year Athletes (4.0%)
0.26 Fourth Year Athletes (20.9%)
0.54 Fifth Year Athletes (43.5%)
Almost two-thirds of the increase in roster-size is made up of fourth- and fifth-year players. It's evident that most top-ranked coaches are acutely aware of the link between a player's experience and their individual achievements. This understanding is reflected in their team compositions. Although we’ve seen a number of high-performing players picked up by top schools through the Transfer Portal, from my experience, most of the experienced talent on top teams are still coming from within their rosters. We see top teams carry more players, increasing the probability for development.
Predominantly, these top-tier teams belong to power-5 conferences, benefiting from substantial athletic budgets. Staying at these prestigious institutions for an additional year is compelling for the players, and financially feasible for the schools. It's not necessarily about the availability of scholarships—since all division one schools have the same number of athletic scholarships—but rather about the resources these programs can offer. These include superior practice facilities, access to premier golf courses, and participation in elite tournaments. Coaches at these institutions proactively retain skilled, seasoned players.
FUN FACTS
Ready for some fun-facts? During his research in writing a book on the NBA, Seth Stephens-Davidowitz found that the most common first name in NBA history is Chris. This tidbit inspired me to look into the same thing for division one men’s golf. What do you think is the most common name? There’s a pretty clear winner…
…
Here you go:
If your name is Jack Smith and you’re reading this - take it as a sure sign that you should become a subscriber!
What about players with the exact same name? Within division one men’s golf there are twelve names shared. Here are the players with duplicate names and the schools they attend:
- **Christian Clark**
- Southern Methodist University
- Southern University
- **Davis Johnson**
- University of Utah
- University of Nebraska-Lincoln
- **Davis Lee**
- University of North Florida
- University of California, San Diego
- **Ethan Dial**
- Texas Christian University
- Southeastern Louisiana University
- **Ian Davis**
- Dartmouth College
- Georgia State University
- **Jack O'Donnell**
- University of Michigan
- Ohio University
- **Jack Tickle**
- College of Charleston (SC)
- University of Nebraska at Omaha
- **Jake Rodgers**
- Marshall University
- Colorado State University
- **Justin Lee**
- Dartmouth College
- University of Arkansas, Pine Bluff
- **Matt Weber**
- University of Louisiana at Lafayette
- University of New Orleans
- **Ryan Smith**
- University of North Carolina
- University of Wisconsin-Madison
- **Tyler Jones**
- Marshall University
- Utah Tech University
I intend to look into this data after the season is over as well. Also, I’m currently looking into the same topics for NCAA Women’s Golf. My hypotheses is there are more successful Freshmen in Women’s college golf compared to Men’s. What do you think?
Next week, we’re looking into substitutions in college golf. How often are subs “successful” in college golf?
To get these upcoming posts straight to your email inbox, subscribe to this newsletter below. Every subscriber lets me spend more time researching aspects I find interest within competitive golf. Thank you for considering 🙏🏻
If you’d like to support my work further, please consider becoming a paid subscriber. In addition to supporting my writing and website work, paid subscribers get access to all of the player development tools on www.mikkelgolf.com. The tools available include a library of performance drills and on-course formats, plus an on-course stats system designed to improve approach play and putting. Five division one golf programs currently use the stats portal. Reach out for more details if you’re interested!
Have a fantastic week!
Best,
Mikkel Bjerch-Andresen
Golf Coach & Analyst
Oslo, Norway


Great post! One of the things I've always found interesting with this type of collegiate data analysis looking at the breakdown of playing time by year expressed as a percentage of playing opportunities. We know for college football (thanks to fantasy football) that age-adjusted % of team playing time is a sticky metric for success in the pros, it's interesting to take that same concept and apply to golf.