


Decrease in performance when closing out a tournament?
A look at data from the last three holes of tournaments across an entire season

Can we see anything in the data about how the pressure of closing out a tournament on the junior level effects scoring?
Nuggets from the more than 60,000 lines of Norwegian Junior Tour scoring data.
To make this scope a bit simpler, I started by filtering down to just one division—the Gutter U19 division (the main boys division). I chose this one as there are the most amount of players in this division, and the scores are more narrowly distributed than the others (tougher competition).
From there, I categorized the final three holes of all the tournaments played this year. I wanted to look at winners, and top-5 finishers in each event. There are a couple of reasons I chose these groups:
Players placing in the top-5 are likely more outcome-focused on the final few holes than a player in the middle of the pack.
I don’t have data on starting holes, so it’s impossible to determine every player’s final holes with certainty—some may have started on the back-nine during the final round. However, it’s reasonable to assume that top-5 finishers began on hole 1, given that they were likely part of the final groups.
First, let’s look at scores to par for the top-5 in the final 3 holes of the tournament:

This is surprising! The dotted red line shows the season-long average score to par for top-5 finishers in the boys’ division. Interestingly, the average score for this group is higher than the overall average on the third-to-last and second-to-last holes of the tournament—but much lower on the final hole. The sample size (n=41) reflects eight tournaments, with one featuring a tie for 5th place. Could performance really improve that much under the pressure of the last hole? Or is this chart a bit misleading? It’s worth digging deeper before jumping to conclusions.
One factor to consider is the distribution of par 3s, 4s, and 5s among these final holes. We know strong players tend to score under par on par 5s and over par on par 3s, so the mix of hole types could have a big impact.

As suspected, the pars of the finishing holes are quite skewed. Therefore, let’s calculate an expected score to par for the top-5 based on the pars of these final holes. For example, we should expect a lower score to par on the final hole as half of them were par 5s. We’ll call this the par logic.

This chart makes more sense now. We can see that the performance on the last hole is as expected when we account for the par of the hole and calculate an expected score based on the season-long averages for top-5 finishers. The correct labels for expected scores on the second- and third-to-last holes are 0.04 and 0.03, respectively.
However, I think it’s even more interesting to look at score to field as that accounts more for how the holes were playing. This is what the par logic vs field looks like:
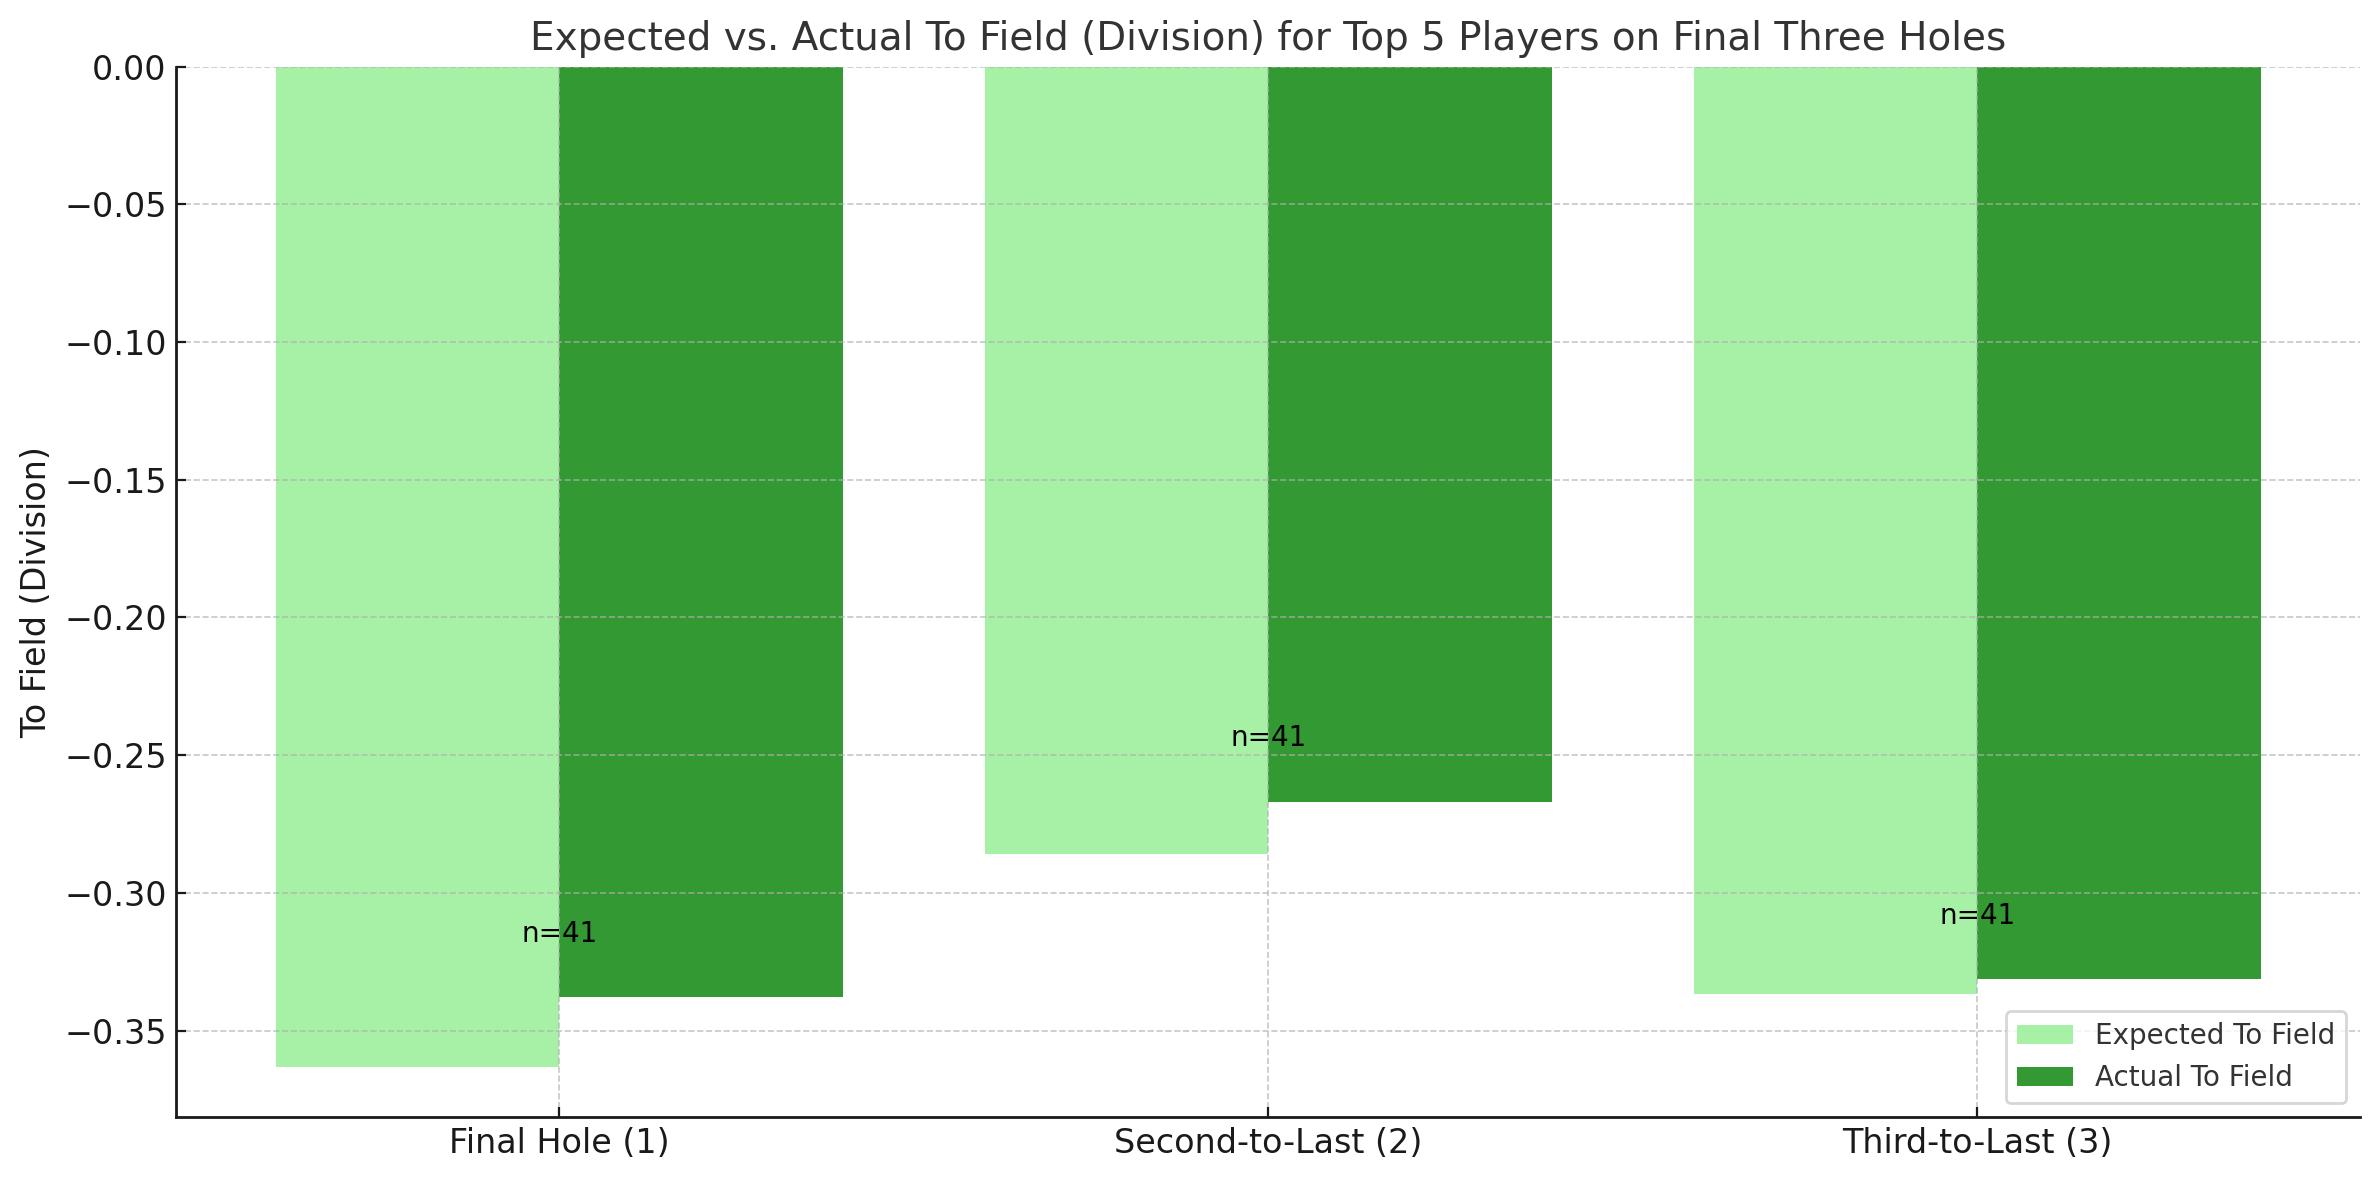
Okay, this is starting to become interesting. Here, we’ve used the same principle - calculating an expected score to field based on the season-long averages of top-5 finishers and the mix of holes in the final holes of the tournaments. When aggregated (chart below). We see how the top-five finishers gain about a quarter of a shot less than expected over the final three holes of a tournament. Could this be the pressure mounting?

When we look at winners only with the same logic we get:
Expected Total: -1.30
Actual Total: -1.00 (n=24)
Also indicating slightly worse scoring than baseline during the last holes of a tournament.
However, remember this graph from a couple of weeks ago?

In this post, we also looked at the boys division. We took the season-long data for the top-10 players (overall ranking) - and looked at their scoring vs hole difficulty. We found that the best players separated themselves most on the most difficult holes (playing the most over par), and the least on the second quartile of holes (somewhat easy holes).
Let’s re-calculate the expected scores for the top-5 players using the same factor logic derived from the top-10 findings. For example, if a hole ranks among the top 10% most difficult of the season, we apply a factor of 1.58, meaning the top-5 player is expected to gain 58% more strokes to the field than their baseline. Conversely, on somewhat easier holes, the top-5 player is expected to gain fewer strokes relative to their baseline.
Here’s the chart for the final three holes using the hole difficulty logic:

Actuals and expected are very close. Optically, I think the change in expected on the last hole makes a big difference. Using the par logic, the top-5 underperformed on the last hole, but using the hole difficulty logic, the players are slightly overperforming.
Let’s look at winners only:

FINAL THOUGHTS:
It’s difficult to conclude from this data whether the pressure of closing out tournaments impacts scoring significantly or not. The last logic—using the difficulty of hole—makes the most sense in calculating expected scores, in my opinion. Both the top-5 and winners perform very much in line with expected scores to field using this logic. Sure, there’s a slight underperformance on the final hole for winners, but with just 8 scores making up that bar, the gap between expected and actual is insignificant. It would be interesting to widen the scope and look properly into this one day.
Have I missed anything here? Would love to hear from you.
Previous posts using this data:
Top-ranked Players vs Field by Hole Difficulty 📊

If you’d like to support my work further, please consider becoming a paid subscriber. In addition to supporting my writing and website work, paid subscriber get access to all of the player development tools on www.mikkelgolf.com. The tools available include a library of performance drills and on-course formats, plus an on-course stats system designed to improve approach play and putting. Seven division one golf programs currently use the stats portal. Reach out for more details if you’re interested in learning more!
Great insight for recruiting all those promising Norwegian players coming through!