

HOW ADVANTAGEOUS IS HOSTING NCAA REGIONALS?
MikkelGolf.com Newsletter #18


A LOOK AT ADVANCEMENT DATA OF NCAA REGIONAL HOSTS
NCAA Post-season is finally here! DI Regionals for the Women start this week, followed by the Men next week. Congratulations to every team and individual advancing to the NCAA Post-season and best of luck to all the contestants!
Regionals is such an exciting week for both players and coaches. In many ways, these weeks are the peaks of college golf. Regardless of regular season the teams have had, every Regional team start the week at even par. Good golf is required in order to secure advancement to Nationals.
Although all teams start the week tied for first, there is an aspect to NCAA Regionals that could provide a competitive advantage: Hosting. The Regional hosting schools are chosen through a bidding process years in advance of the actual Regional Tournament. Most college golf fans assume hosting is a huge competitive advantage at the most pivotal tournament of the year - but is this really true? If true, how big of an advantage is hosting an NCAA Regional Tournament?
In order to find out, I teamed up with David Tenneson, author of 5 Count 4 and aspiring college golf historian. One of the libraries David has organized is the scoring data from NCAA Regional and National Championships on both the Men’s and Women’s sides, dating back to the start of Regionals (1989 for the men and 1993 for the women). The rest of this article is a collaboration between David and myself.

MEN’S DI REGIONALS
A BRIEF HISTORY LESSON
Men’s collegiate golf introduced Regional tournaments in 1989 as a way to create a qualification standard for teams seeking to lift the NCAA trophy at the end of the season. Even though it took 50 years to install, the Regional concept goes all the way back to the first NCAA championship in 1939, when then-Stanford coach Eddie Twiggs commented that the championship tournament had become “unwieldy” and that some qualification standard should be created rather than simply allowing in any team that had 4 to 6 players and the money to travel (which is somewhat ironic given the fact that Stanford players had to pay their own way during the WWII years).
The start of a new century (and millennia) brought with is some fairly significant changes to men’s college golf. Beginning in 2009, the team championship was decided by match play, an element that hadn’t been seen in the championship since pre-WWI. Coinciding with this change was an update to the Regional format, expanding from three to six Regional sites. Although this added significant complexity in both finding more sites and selecting which teams were assigned to a given Regional, there were also significant benefits. Fewer teams at each site meant fewer players, which in turn allowed each round to be played in one “wave” of tee times rather than sending teams out in split early and late waves.
The current Regional format has remained consistent since 2009. Six Regional fields are made up of 13 or 14 teams where the top 5 teams advance.
2009-2023 DATA: Overall Probability of Advancement by Seed
Below are the overall advancement rates per Regional Seed from 2009 through 2023:
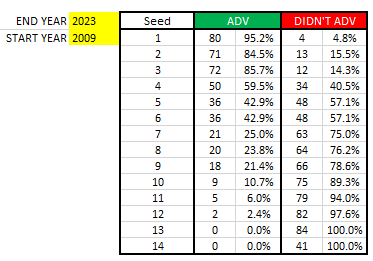
#1-#3 seeds all have advanced more than 85% of the time. We see a noticeable drop-off to the #4- and #5 seeds with 59.5% and 42.9% respectively. An interesting stat to note is that #6 seeds have advanced as often as #5 seeds over the past 15 years (42.9%). We see another noticeable drop-off to the #7 - #9 seeds which all advanced between 21% & 25% of the time over the past 15 years. No #13 or #14 seeds have advanced, and just 2 #12 seeds have gotten to the National Championship.
Here is the break-down of where the different seeds have placed:
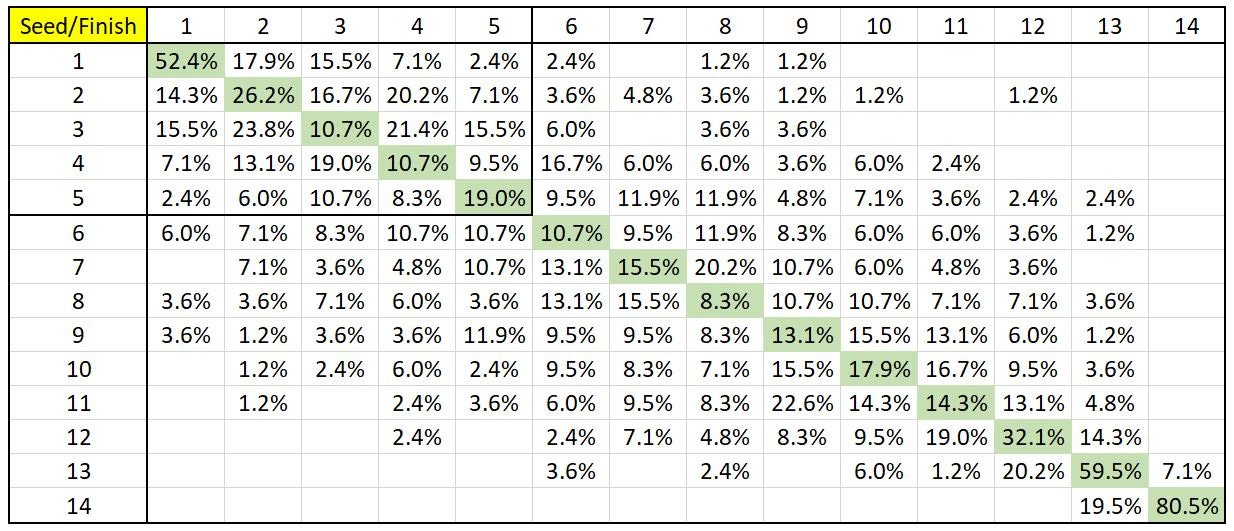
An aspect that stands out is the Regional winning rate of #1 seeds. Over the past 15 years, the top seed has won the Regional tournament more than half of the time. Further, the highest seeds to have won a Regional are #8 and #9 seeds, with 3 wins each.
HOSTING - Is there an advantage to hosting?
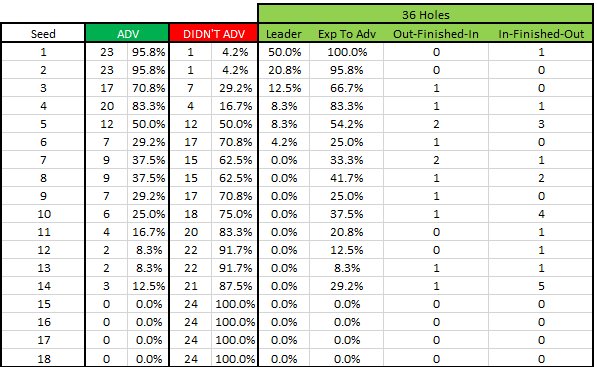
The following chart expands on the advancing/non-advancing data discussed above by also showing the number of times each seed has hosted a Regional tournament and their “success” in advancing to the NCAA tournament.

The first thing to observe on host success (the right portion of the table) is that the best schools host the most. Since there were no Regionals in 2020, the span we’re looking at (2009-2023) should equal: 14 years * 6 regional sites = 84 total hosts - 25 times when the host team was not in the field (but may have had an individual qualify) = 59 host teams in the field for their Regional. 13 of these 59 have been #1 seeds. 47% of hosts have been #1, 2, or 3 seeds.
As five teams qualify for Nationals out of each Regional Championship, the top 5 seeds (seeds 1-5) are expected to advance. We see that top-5 seeds advanced “as expected” at a 90% rate as a group when hosting. The remaining seeds also had a high rate of advancing, raising up to as high as 50% as a group if we exclude the #13 seeds.
The most glaring numbers are the #5-7 seeds which constitute the “bubble” teams. When we analyze seed by seed, the sample sizes get very small. However, it is noteworthy that host #5 seeds have advanced just once in four tries. Is this #5 seed stat an anomaly or are there certain pressures involved in hosting for bubble teams who are “expected to advance”?
Digging down further, David found that all four of those #5 seeded teams were sitting just outside the cut number after 36 holes, and only one improved enough the final round to make it in (on the number). Interesting!
Further, the two #7 seeded host teams that advanced were at or inside the top 5 going into the final round with the other four failing to make the push. Likewise, both #6 seed were comfortably inside the cutline after 36 holes and finished at almost the same position.
This might suggest that host teams around the bubble who capitalize on their home-course advantage and get inside the top-5 early will likely stay there, but being around the cut line going into the final round as a host is much less of an advantage, or no advantage at all.
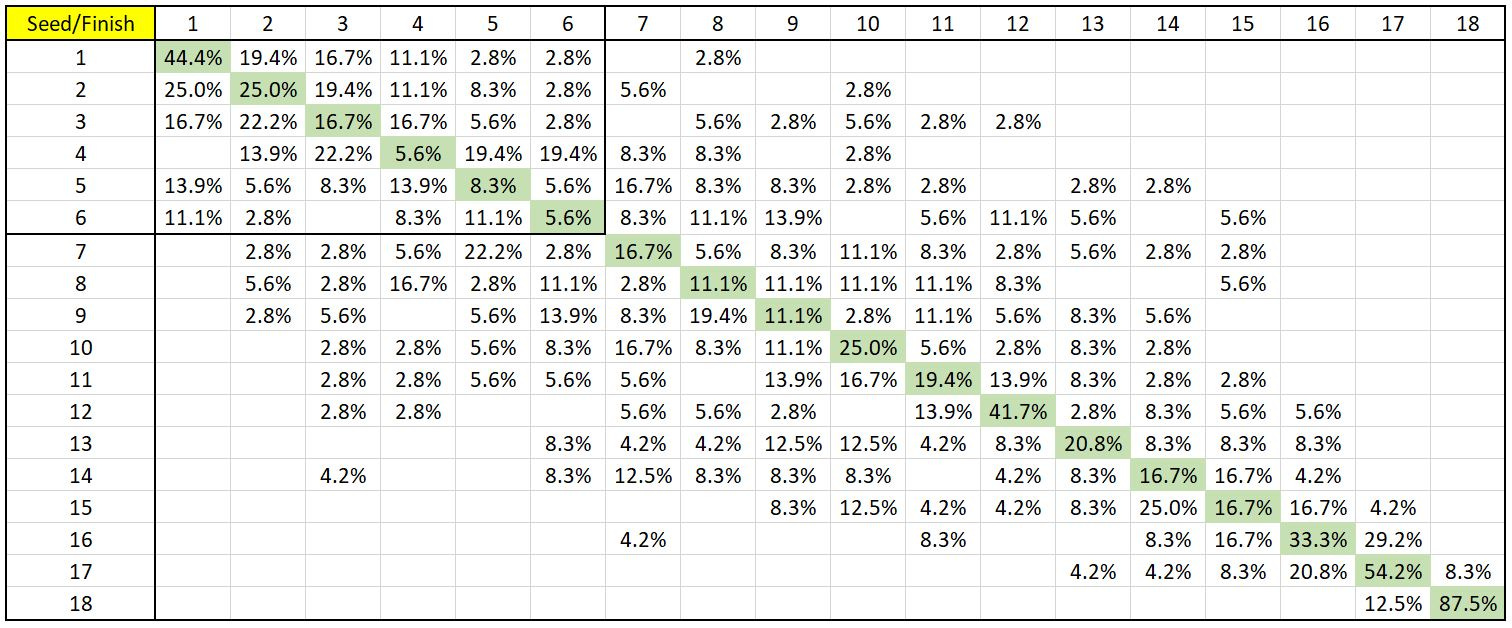
The chart below shows all teams (host & non-host combined) by seed. The light green portion of the table contains information about standings after 36 holes of the tournament. What do you notice about final round movement?

STROKES GAINED
Much has been made this year of the concept of Strokes Gained (SG) being added to collegiate golf with the new rankings, so we thought it might be interesting to take a look at that in relation to host vs non-host team scoring. Unlike the typical “strokes gained’ numbers that fans have become used to seeing on pro golf telecasts - which uses distance-from-the-hole data to qualify each shot as having gained/lost fractions of a stroke - these college golf SG numbers focus on the total score, which is a simple measure of the field average minus the team score; hence a positive result being a good score. While not a perfect metric, this aims to give further context to a team’s performance relative to the rest of the field.
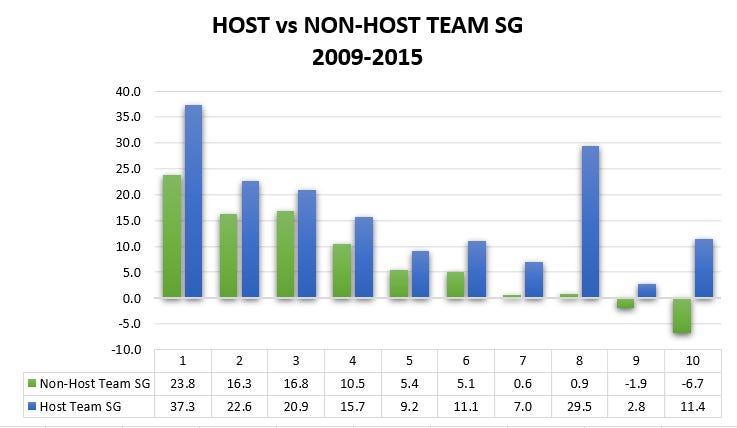
It’s fairly obvious from this graph that hosting a Men’s Regional tournament is advantageous for each of the top 10 seeds. Even with the limited sample sizes, the trend on ‘Strokes Gained’ seems clear. Hosting is very advantageous. We can see how most seeds average about 6 strokes better versus the field when hosting.
#1 seeds are excellent golf teams regardless of hosting duties proven by their advancement rate of 95.2%. What’s interesting is that even for the best teams, knowing the course and being familiar with the grasses boost performance significantly. #1 seeds gain 56% more strokes on the field when they are hosting. Gaining 56% more strokes on the field has led #1 seeds to advancing every time they’ve hosted a Regional (13 occasions) vs. the 95.2% overall advancement rate.
WOMEN’S DI REGIONALS
HISTORICAL PERSPECTIVE
Three years after seeing the success of the Men’s Regional tournaments, the NCAA Executive Committee approved the recommendation to add Regional tournaments to D1 women’s golf beginning in 1993. What started as two tournament sites advancing a combined 17 teams to the NCAA championship eventually grew to three sites with 24 teams advancing.
Beginning in 2015, the women’s regional format changed from three host sites with 8 teams advancing from each site to four sites with 6 teams advancing, maintaining that total NCAA championship field count of 24. The change coincided with the addition of the match play element in the NCAA championship to decide the team champion after the conclusion of stroke play. In 2022, the number of regional sites increased to six, however the total number of advancing teams remained at 24 (meaning four teams advanced from each site). A 2023 change to 30 total advancing teams, five from each of the six sites, finally made the women’s regional format match the men’s.
2015-2021 DATA
The six years of Regional data from 2015-2021 provides the best comparison for our purposes today.

We can see from the chart above that, just like for the men, there is a drop off in the success rate after the #2 seed, however for the women the #4 seed has actually advanced to NCAAs more often than #3 seeds. Additionally, we see that the #7 and #8 seeds both have a better rate of advancing “unexpectedly” than the #6 seed, which is the last spot for qualification to make the NCAA tournament. Even the #9 and #10 seeds have practically the same advancement rate as the #6 seed during this timeframe. This suggests an element of parity once you get outside of the top ~25 ranked teams.
Here is a breakdown of the how each of the seeds finished, with the seeding listed along the left column and the final position listed along the top row:
HOSTING
There are some interesting things that jump out when looking at the rate at which teams that host a regional successfully (or not) advance to the NCAA tournament on the women’s side.

For one thing, the host teams that were already expected to advance based on their seeding are successful at a high rate, but curiously the only #2 seed to not advance during this timeframe was also hosting. The other two hosts that failed to make NCAAs were on the positive side of that “bubble” range (1-2 spots above or below the cutline of 6 teams).
As you might expect, the bubble teams on the other side of that cutline generally benefited from hosting, but even those seeded lower, sometimes much lower, were successful as well. Just as we saw with the men the women’s host teams that were inside the cut after 36 holes finished there while those outside failed to improve enough to make it, which probably speaks more to the pressure they put on themselves more than anything tangible within this dataset.
STROKES GAINED
Another way to view this success is by looking at the same Strokes Gained data as we did on the men’s side. Below we see the average SG differential for each seed for teams that hosted versus those that did not. Two things to note with this chart:
There were no 10 seed hosts, so “0.0” is more accurately “N/A”
This does not include the infamous 2021 Baton Rouge Regional data since no shots were made/played

It’s interesting that non-host #1, 2, 4, and 6 seeds had slightly better SG scores on average over those with hosting duties. Even though these are very small sample sizes - several had just 1 occurrence - the huge difference for the #3, 5, 7, and lower seeds in favor of the host teams is glaring considering the cutline at 6 teams.
ADDING THE 2022 & 2023 DATA

The format changes in 2022 and 2023 cause a bit of a mess when trying to organize this same data cleanly, however we can see from the green and purple colored areas - which do account for the variability in the number of advancing teams - the percentage of host teams advancing goes up, whether they were expected to advance or not. In fact, all 7 of the host teams in 2022-23 made the NCAA tournament. Note: not all host teams make it to Regionals, which accounts for the other five teams (the host team was not in the field for 4 of the 6 host sites in 2023).
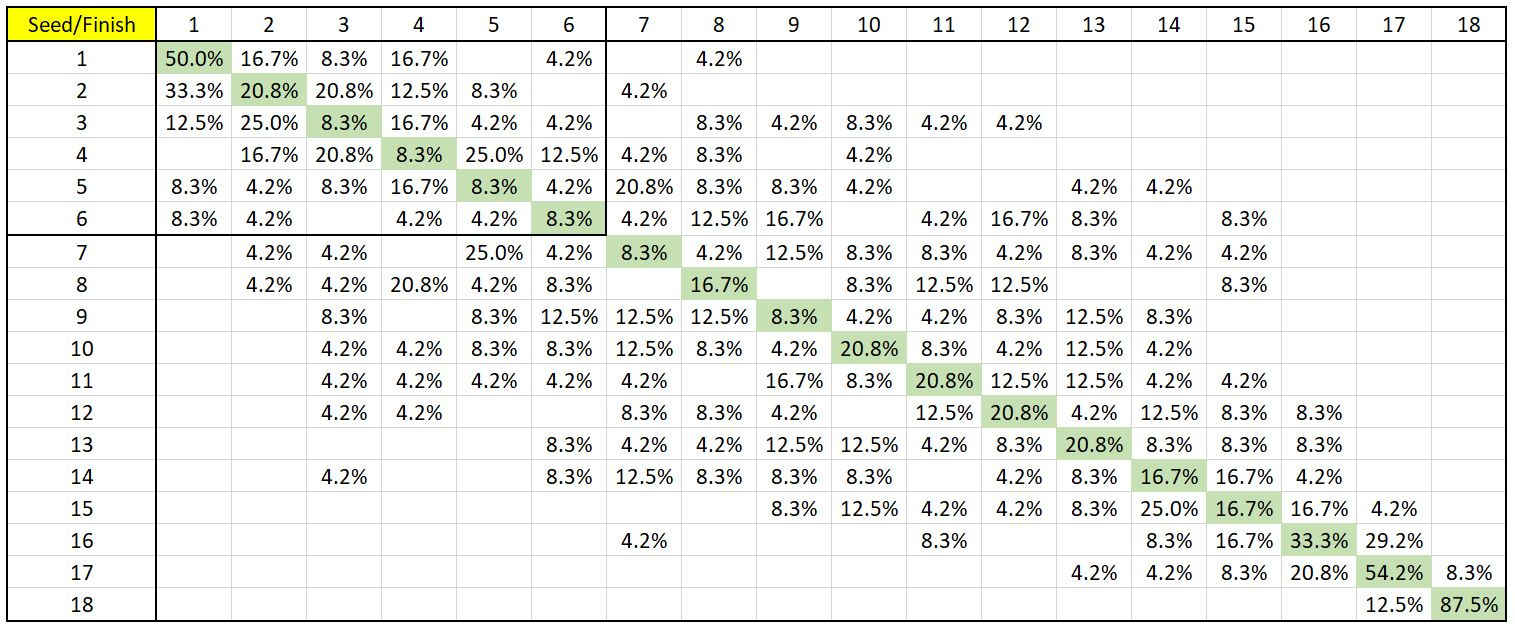
Overall women’s probability of advancing 2015-2023:

As we can see, the lower seeded teams advance more often. This is hardly surprising. What may be surprising, however, is that the overall success rate of the #2 seeds went down as one of the 2 seeds failed to advance in 2022 and three failed in 2023. This gives even more importance to hosting, even for those teams already expected to make NCAAs. Both of the teams that hosted and advanced “unexpectedly” in 2022-23 were in that bubble range, one being a #6 seed and the other a #8 seed.
Here is the updated breakdown of how each of the seeds finished:
CONCLUSION
As much added stress and pressure hosting a Regional puts on the coach, and players, it seems that the payoff is worth it, especially for programs that happen to be ranked somewhere 25-65 (#5-11 seed) at the end of regular season play. There is a much more obvious benefit for all seeds on the men’s side when looking at the Strokes Gained data, however that same data - albeit over a much smaller timeframe - on the women’s side suggests that it is more of a burden on the higher-seeded teams. At the very least, we’re not able to see a clear positive impact of hosting for the best Women’s golf teams with the limited data we have. Nonetheless, for both the men and women, advancing by 1 stroke or 100 strokes doesn’t matter so long as teams make it to the NCAA tournament, and the success rate for host teams give credence to the notion that hosting is almost always beneficial.
Next week, we will look at the same Regional data on both the men’s and women’s sides and try to answer “Is there more parity in college golf these days?” We look forward to sharing the findings with you! Subscribe below for free to get the article straight to your email inbox.
Best of luck to all the NCAA Regional contestants this week! And thank you so much, David for your excellent work on this article!
If you’d like to support my work further, please consider becoming a paid subscriber. In addition to supporting my writing and website work, paid subscriber get access to all of the player development tools on www.mikkelgolf.com. The tools available include a library of performance drills and on-course formats, plus an on-course stats system designed to improve approach play and putting. Five division one golf programs currently use the stats portal. Reach out for more details if you’re interested!