


IS THERE MORE PARITY IN COLLEGE GOLF?
MikkelGolf.com Newsletter #19


CHANGES IN REGIONAL ADVANCEMENT OVER TIME
Ask any seasoned college coach about how the game has changed since they first started coaching, and they’ll quickly argue that there’s more parity in college golf these days. You’re likely to hear something like: “Back in the old days, just a select few schools actually cared about their golf team. Now, college golf is on tv, universities are understanding the importance of fundraising through golf, and coaches are making more money than ever.”
As a former college golfer myself, I’ve heard versions of this observation from seasoned coaches countless times. “There’s more parity in the game.” Even during my seven-year collegiate coaching career, I sensed the competition sharpening. I wanted to look at whether the statements from more seasoned coaches and my own personal observations were true. Is there really more parity in college golf these days?
I teamed up with David Tenneson, author of 5 Count 4 and aspiring college golf historian. One of the libraries David has organized is the scoring data from NCAA Regional and National Championships on both the Men’s and Women’s sides, dating back to the start of Regionals (1989 for the men and 1993 for the women). The rest of this article is a collaboration between David and myself.

MEN’S DI REGIONALS
In an effort to answer the parity question, we used the Regional scoring data from the database, and looked at advancement rates to the National Championship. Let’s start with the Men’s side before we cover the Women:

This chart shows us the advancement percentages since the change to the 6-Regional system of #1 seeds (blue line), #2 & #3 seeds (green line), #4 & #5 seeds (purple line), #6 & #7 seeds (yellow line), and the remainder of the field (red line). We can see an indication of advancement for the top three seeds have remained consistent and highly probable. However, we can also observe how there seems to be closer gaps between the bubble teams (4-7 seeds), with the exception of the 2018-2020 period (2020 season was cancelled). Let’s look closer at the bubble teams (4-7):

Advancing looks like it has gotten quite a bit more challenging for the 4-seeds. Over the past three years (2021-2023) we see that advancement percentages are very tightly dispersed between the 4, 5, 6, and 7 seeds. In fact, in men’s DI golf, both #5-seeds and #6-seeds have had higher advancement percentages than the #4-seeds over the past three years.
Even though our scope for this article is 2009 till present due to the Regional format being consistent during that time, let’s have a look at advancement percentages even further back for fun:

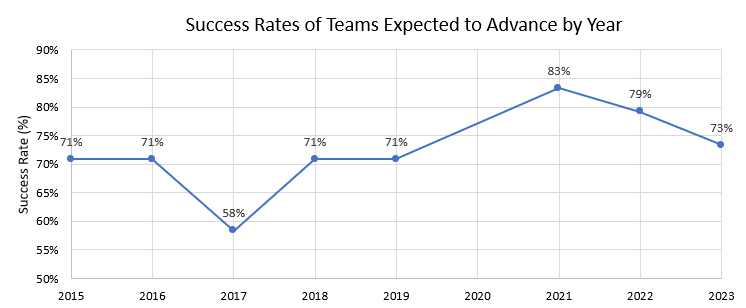
The above graph shows advancement percentages of teams that were “expected to advance.” For example, in the current 6-Regional format where five teams advance out of each Regional, the top-5 seeds going into the tournament are “expected to advance.” As we can see, advancement percentages of teams expected to advance has significantly declined over the last couple of decades.
Since we noticed the parity in college golf seemingly affecting #4 and #5 seeds mostly over the past 15 years, let’s look at advancing percentages for those seeds over the going back to 2000:

As we can see, again, it looks like the top three seeds are holding court. Conversely, the probability of #4 and #5 seeds advancing has taken a nose-dive. This is definitely evidence that there’s more parity in Men’s Collegiate Golf. Teams seeded 6 and higher at Regionals are a lot better, and is giving the #4 and #5 seeds tough competition for their expected qualifying spots.
Another area where we can see this play out is in the Strokes Gained (SG) data. Much has been made this year of the concept of SG being added to collegiate golf with the new rankings, so we thought it might be interesting to take a look at that to see if that can highlight the parity we’re seeing in the advancement rates. Unlike the typical “strokes gained’ numbers fans have become used to seeing on pro golf telecasts - which uses distance-from-the-hole data to qualify each shot has having gained/lost fractions of a stroke - these college golf SG numbers focus on the total score, which is a simple measure of the field average minus the team score (hence a positive result being a good score). While not a perfect metric, this aims to give further context to a team’s performance relative to the rest of the field.
Keep in mind for the charts below that this is an average of the SG data results from each of the six Regional sites each year for any given seed.
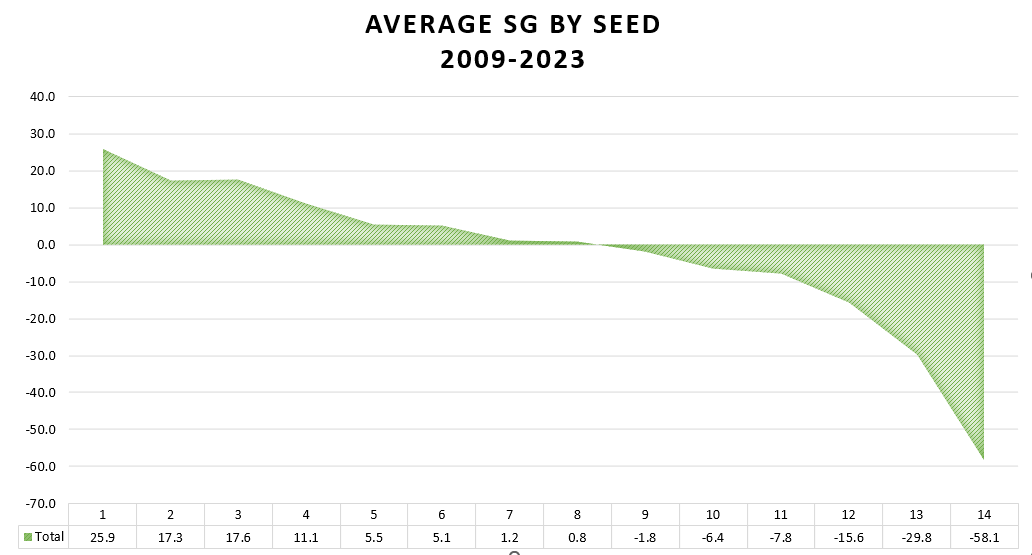
Unsurprisingly, #1 seeds gain the most strokes to the field, and #14 lose the most. What’s noteworthy is the tight gap from #4 seeds all the way through #11 seeds. There’s less than 20 strokes on average separating all of these seeds, giving us a lot of capable challengers for qualifying spots.

The above chart showing the changes in SG averages for each seed going from 2009 to 2023 is pretty helpful in visualizing that same concept. Also visible on this chart is the bar connecting the #1 seed value with the #8 seed value, which serves to see the closeness of those seeds. While this graph shows that the average SG values for the top 3 seeds are approximately in the same range now in 2023 that they were at the start of this format change in 2009, the #4 seed has come down, the #5 seed went down and then has come back up, and the #6-8 seeds have generally increased. In the last 3 years, the #7 seed has had a downtrend that perhaps correlates with the #6 and #8 seeds gaining fairly significant upticks.
WOMEN’S DI REGIONALS
Over the last couple of decades, NCAA Women’s DI Golf has seen more format changes than the Men’s side. We decided to look at Regional scoring between 2015 and 2021 as the Regional format has remained consistent throughout this time with four regional sites advancing six teams per site.

As we’re dealing with a shorter timeframe for apples-to-apples data on the Women’s side, it’s harder to see any clear trends out of this graph. You’ll note that we added the 2022-23 grouping at the end of these charts just to see what the data looked like, and the results were interesting. The 2022 Regional format change increased the number of sites to 6 but lowered the number of advancing teams at each site down to 4. The 2023 change increased that number to 5 teams advancing from each site, finally adopting the same format for the women as the men have had since 2009. With such a small timeframe and the added mixing of formats, it’s difficult to form any conclusions regarding parity.
That said, we can look at the strokes gained data to see how teams at each seed are scoring on average relative to the rest of the field. Keep in mind for the charts below that this is an average of the SG data results from each of the four Regional sites each year for any given seed. Also note that the 2021 Baton Rouge Regional was not played and therefore is not represented in any of this data.

First we can look at the total SG average for each seed over the entire 2015-2021 span. As expected, the top seeds average better SG values, however there is a large section around that 6-10 seed bubble that is fairly close, indicating parity for a pretty large section of the field. As mentioned above, the top 2 seeds are pretty much cemented at the top of any given tournament field, however the 3-5 seeds are not far off from one another which is another indicator of parity.

The above chart showing the changes in SG averages for each seed going from 2015 to 2021 is perhaps the best indicator of the scoring parity in the Regional tournaments. We can clearly see that each of the top 4 seeds have a general downward trend in recent years while seeds 5-7 are trending up. Furthermore, by 2021 there was a fairly close meeting of the SG averages for nearly all of these seeds. Since the field sizes are smaller starting in 2022 with the increase to six Regional sites, it wouldn’t be helpful to add the 2022 and 2023 data to that chart, however it’s important to note that the trend is continuing (as seen below), again suggesting ongoing parity.

CONCLUSION
The statement “There’s more parity in college golf these days” looks like it holds water both on the Men’s and Women’s sides, even when looking at just the postseason data in the last couple of decades. The top teams are advancing to the National Championship at a high rate, but bubble teams who are “expected to advance” are experiencing a lot tougher competition from outside-looking-in teams. This is evident both from the advancing data, and also from the strokes gained data.
It certainly makes post-season college golf an incredible product. We can’t wait to watch how it all unfolds this year!
Best of luck to all the NCAA Regional contestants this week! And thank you so much, David for your excellent work on this article!
If you’d like to support my work further, please consider becoming a paid subscriber. In addition to supporting my writing and website work, paid subscriber get access to all of the player development tools on www.mikkelgolf.com. The tools available include a library of performance drills and on-course formats, plus an on-course stats system designed to improve approach play and putting. Five division one golf programs currently use the stats portal. Reach out for more details if you’re interested!
 | A guest post by
|