


Evidence: The Importance of Patience in Golf
MikkelGolf.com Newsletter #15

Let’s say you’ve decided you’re going to improve your putting. You tell yourself: “This is the year. I’m going to practice like a wild man, and sink every putt!”
You envision your strokes gained putting skyrocketing as a result of what you think will be a one-to-one relationship between hours spent on the practice green and your make percentages.

I absolutely love the ambition and willingness to work! Without this, there’s very little chance you’ll ever improve your putting. You need to do the work. However, are your expectations realistic?
If we use strokes gained putting as the measure of putting performance, the #1 ranked putter on the PGA Tour as of April 4th is Aaron Baddeley. Mr. Baddeley is gaining a very impressive 1.028 strokes per round on the greens this season.
The graph below shows Aaron’s Strokes Gained Putting per round over the last 34 rounds he’s played on the PGA Tour, dating back to 3M during the 2023 season.

That doesn’t look very much like the graph we optimistically imagined above! Right away, we can see how the best putter in the world has had rounds where he both gained about four strokes and lost about four strokes putting. In the last 34 rounds, the world’s best putter lost strokes putting on 8 occasions. Is that more than you would have thought?
The graph of the world’s best putter looks less like the one we imagined earlier, and more like the one below:

This is a monthly view of the S&P 500 index. 30 days vs. 34 round is comparable. We can see how there are peaks and valleys, and hard to predict what happens in the market any given day.
However, when we look at the market over a longer period of time, it gets easier to spot trends. Here is the S&P 500 index over the past 5 years.

We still observe short-term movements, but the trend becomes quite clear. Seems like a good idea to be invested in this market over the long haul. Just like in putting, you need to be invested in the market (stay committed to your process and practice routine) over a longer period of time to truly spot your returns (development).
As the Baddeley graph is so up-and-down and hard to decipher if Aaron has improved his putting or not, let’s add a trendline to see if we can spot anything:

I’ve used the simplest trendline here, the linear one. The point of the trendline is to see how we the performance has changed over time. Aaron’s graph has a very straight trendline, indicating that his putting skill has remained steady. Ideally, we would have even more rounds to look at, but 34 rounds is a good indication.
This context is the feedback you need to decipher whether you are really improving or not. The day-to-day has too much variance and is not sufficient information for you to determine if you are getting better or not.
The day-to-day has too much variance and is not sufficient information for you to determine if you are getting better or not.
As a coach, this is such a common error I observe in players. A player has a poor putting day, and quickly loses confidence in their putter. They end up changing putting style by altering their grip, changing their putter, or other quick-fixes. Sometimes even during the round! In my experience, this is often the start of a bad spiral. It’s an error in not understanding the game correctly. We’ve seen how the best putter in the world can gain or lose up to four strokes putting in any given round, so why would you throw everything at sea once you miss a couple of short putts?
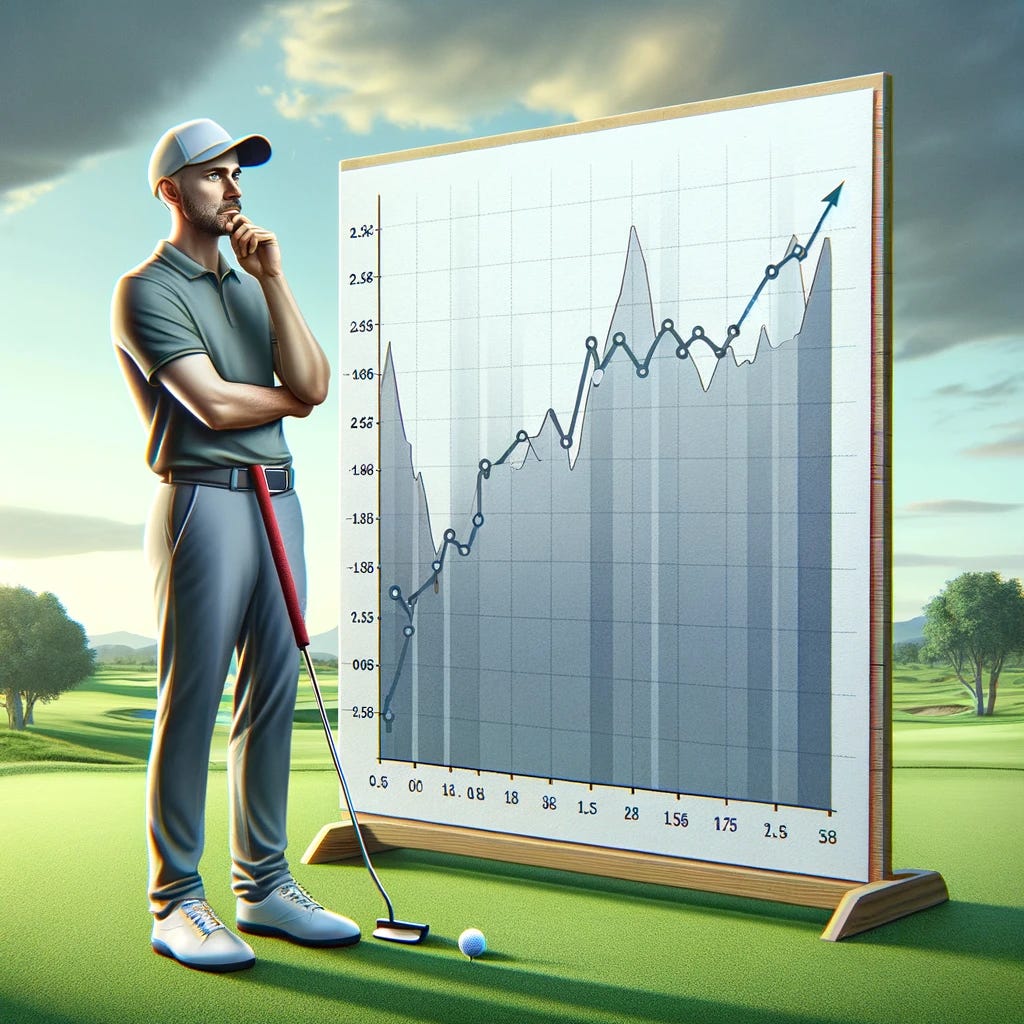
Going back to the very first picture of this article. Let’s ask Chat-GPT to update it. Form this:
To this:
While scrolling Instagram earlier this week, I came across a picture that Chattanooga Men’s Golf Coach, Blaine Woodruff, posted. It’s even better than what Chat-GPT was able to produce for me:

Finally, I found an old graph from the 2019/2020 Texas Tech team while I was coaching there. The season was cut short due to covid. We had a very strong team with several good players. Included was Ludvig Aberg as a freshman. We focused on putting as a team and kept track of our strokes gained putting as a team. Here’s what that graph looked like up until Covid hit:
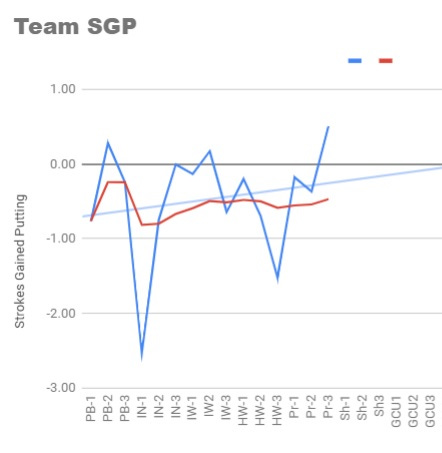
Weathering the storm and having patience is so critical to player development. Do your best to avoid making emotional decisions about your improvement plan.
Have a great week!
If you’d like to support my work further, please consider becoming a paid subscriber. In addition to supporting my writing and website work, paid subscriber get access to all of the player development tools on www.mikkelgolf.com. The tools available include a library of performance drills and on-course formats, plus an on-course stats system designed to improve approach play and putting. Five division one golf programs currently use the stats portal. Reach out for more details if you’re interested.
GREAT STUFF!!!!