


Running all the numbers - Omni La Costa
Deep-dive into the 2024 Men's NCAA DI Championship


For this post, I recruited the help of one of the players I’m coaching.
Petter Dale just completed his Sophomore year at Campbell University. Petter and I decided take a deeper look into the scoring data from last year’s NCAA Men’s Championship from Omni La Costa. We analyzed all of the scores from the stroke play portion of the event. It amounted to 9,450 hole scores analyzed.
Our main objective was to figure out what the best teams did well last year - where did the match play teams create separation from the field?
We published a dashboard with all the data on petter’s website. You can find it HERE.
In the tool, you’re able to filter for counting scores, your favorite team, etc. The screenshots in this article will all be from the dashboard.
The tool is free to everyone. Please subscribe for free to support our work:
Holes with high Scoring variability
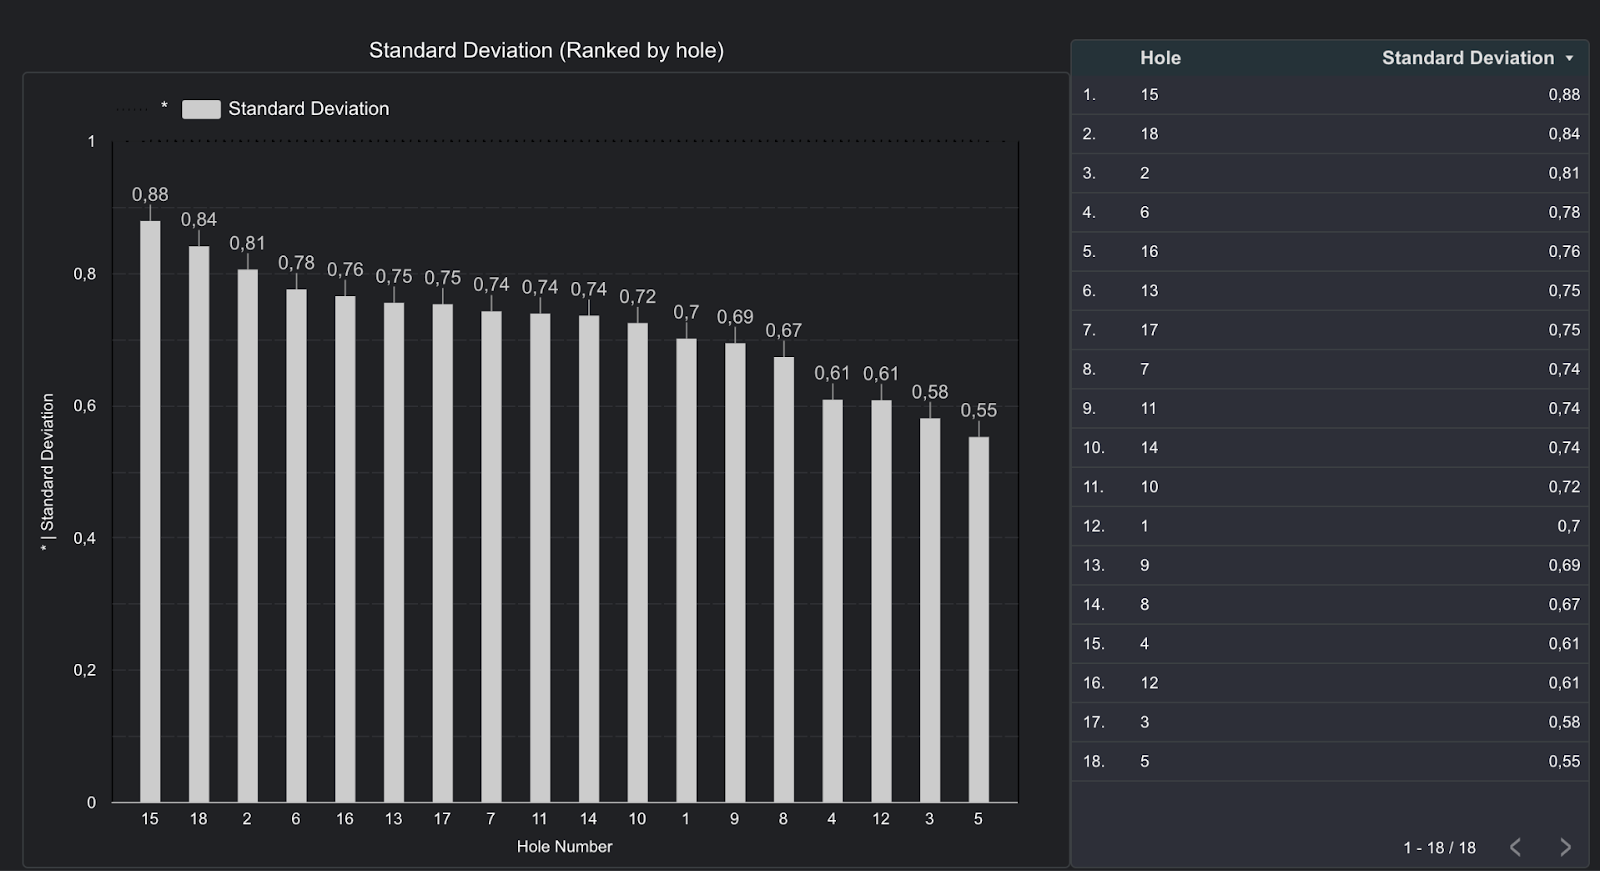
The holes shown above are ranked by standard deviation (SD) per hole. The SD describes how spread out the scoring was for that particular hole during the 2024 championship (during stroke play). A hole with high SD punishes mistakes and rewards precision more than holes with low SD.
15:
The hole with the greatest score variability was hole 15 with a standard deviation of 0.88.Hole 15 ranked 2nd in par 4 birdies only after hole 11, but also ranked 2nd in Double bogeys and worse for the par 4s - a volatile combination.
Hole 15 was only the 10th hardest hole in relation to par last year, but its huge score variability makes it super important for teams wanting to stay longer than 3 rounds. The numbers in the chart below also reflects hole 15’s importance.
Teams making the cut played hole 15 0.14 strokes better than field average (4.03 vs 4.17).
In broader strokes, the back-nine saw large separation in the field in 2024.
8 of the 11 highest SDs were on the back-nine last year.
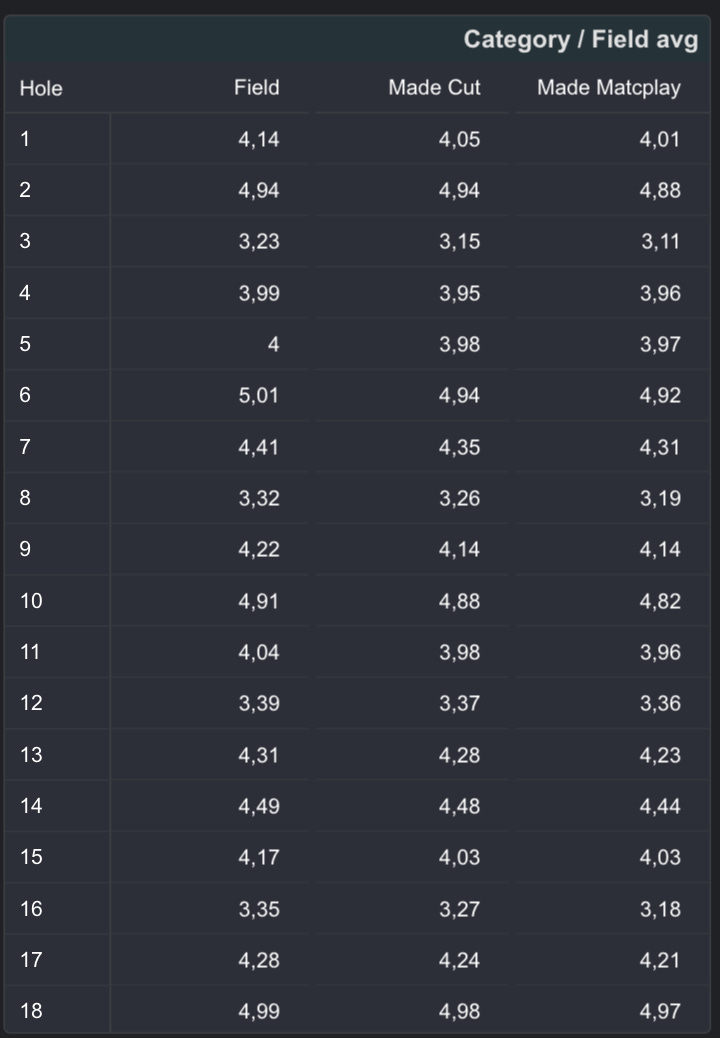
The table above shows the average scores of a) the entire field, b) teams which made the cut, and c) teams which made match play.
Hole 16 was the biggest difference between teams making the cut and match play teams.
Making match play - Bogeys vs Birdies
The chart below shows the round-by-round breakdown of teams which did not qualify for match play (blue bars) vs. teams which qualified for match play (green bars).
(Again, these screenshots are from the public dashboard on Petter’s website. You can filter this data yourself HERE.)
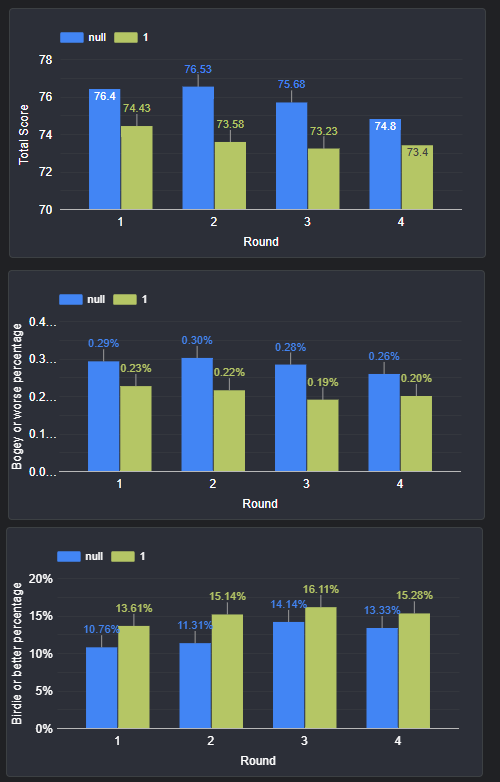
It’s no surprise that the match play teams had lower scoring averages in every round. The lower scores were made up by more birdies or better and less bogeys or worse in each of the rounds. However, when cumulated for the tournament, match play teams had a birdie-or-better percentage of 15.33% and a bogey-or-worse percentage of 20.80%. Teams which did not qualify for match play had 12.19% in the former category, and 28.93% in the latter. The majority of the separation for match play teams last year can be attributed to limiting mistakes.
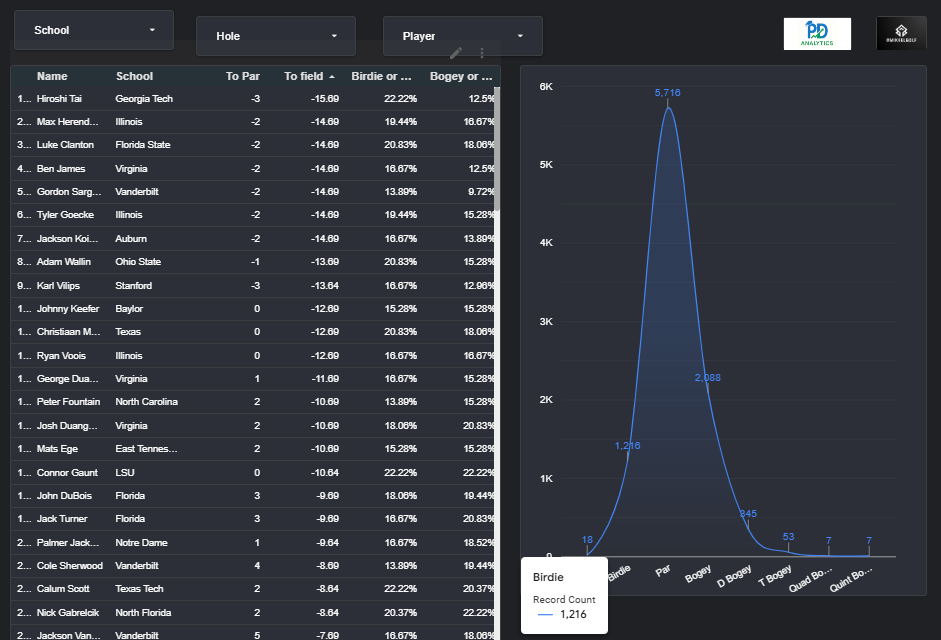
The Scoring Bell Curve
We also put together a scoring bell curve-page with filtering functionality. You can filter by school, hole, or single player.
Overview
Finally, we have put together an overview page with hole-by-hole breakdowns comparing match play teams and the entire field.

We hope this info helps both the teams and the fans get the most out of the 2025 championship. Best of luck to all the teams out there!
One last plug - the dashboard can be found HERE.
 | A guest post by
|