Greetings curious golfers!
Today’s question is: “What does a common college golf career look like?”
As we’ve seen in a previous newsletter, the average college golfer gets 71 competitive rounds during their college career.
In order to further enhance our understanding of what to expect out of a college career, I think it’s beneficial to look at college golf scores plotted over four years. To not offend any “average” college golfers out there, I pulled the data from a player I know very well… Myself!
I would categorize my own college career as in the “average” realm. I was fairly consistently in the line-up during my four years at Baylor University. We were typically ranked between 25th and 40th, with a few exceptions. My highest World Amateur Golf Ranking was just inside the top-200. I was never an all-American or all-conference player. I did win a prestigious tournament, the Royal Oaks Collegiate, and garnered some other top-5 finishes. However, I also had some severe lows and posted a 77 scoring average during my Junior year. My college career from a scoring perspective might have been a tad more rocky than the truly “average college golfer” (whatever that phrase means 😉), but let’s go ahead and look at it.
In another former post on this Substack, we looked at the best putter on the PGA Tour (at the time Aaron Baddeley). We plotted the strokes gained putting from his last 34 rounds on tour. The performance graph of the world’s best putter looked more like the stock market, exhibiting severe variance and completely unpredictable on a day-to-day basis.
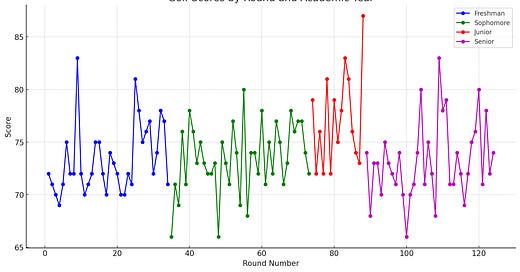
I think we might be in for more of the same when we look at my college scores:
Yep, that’s a lot of movement!
Here are all my scores aggregated:
My career scoring average ended at 73.79. I happened to get more competitive rounds than the 71 we’ve calculated previously. In 124 rounds, my range was from 66 to 87. Per academic year, my scoring average was the following:
Freshman 73.32 (34 rounds)
Sophomore 73.44 (39 rounds)
Junior 77.20 (15 rounds)
Senior 73.19 (36 rounds)
As you can see, my college career statistics does not reveal the slow and steady progression we all envision when enrolling in college. I'm currently working on an in-depth series covering the most common errors I see from junior and college players. I committed most of these errors myself during my own player journey. I intend on covering what I observe as a coach and my reflections around my own player journey in this series at a later point. If you have not done so already, subscribe below to make sure you’re not missing the series when it drops:
Let’s look at a distribution chart of all the scores I shot in college:
The mode (most common score) was 72. The average: 73.79. Median: 73. Lowest score: 66. Highest score: 87. Total amount of strokes: 9,150.
To be fair, when you start your college career, this is more or less what you can expect from your 71 Scorecards. Your average might be better than mine, or it might be worse. Regardless, you will end up shooting a large range of scores, and you have to learn how to handle variance not going your way.
I have to admit, I lived and died with almost all of these rounds. Good or bad, I felt every round. Out of almost ten thousand shots hit during my college career, I remember most of them. Again, I will go deeper into my playing career and the errors I made in an upcoming series.
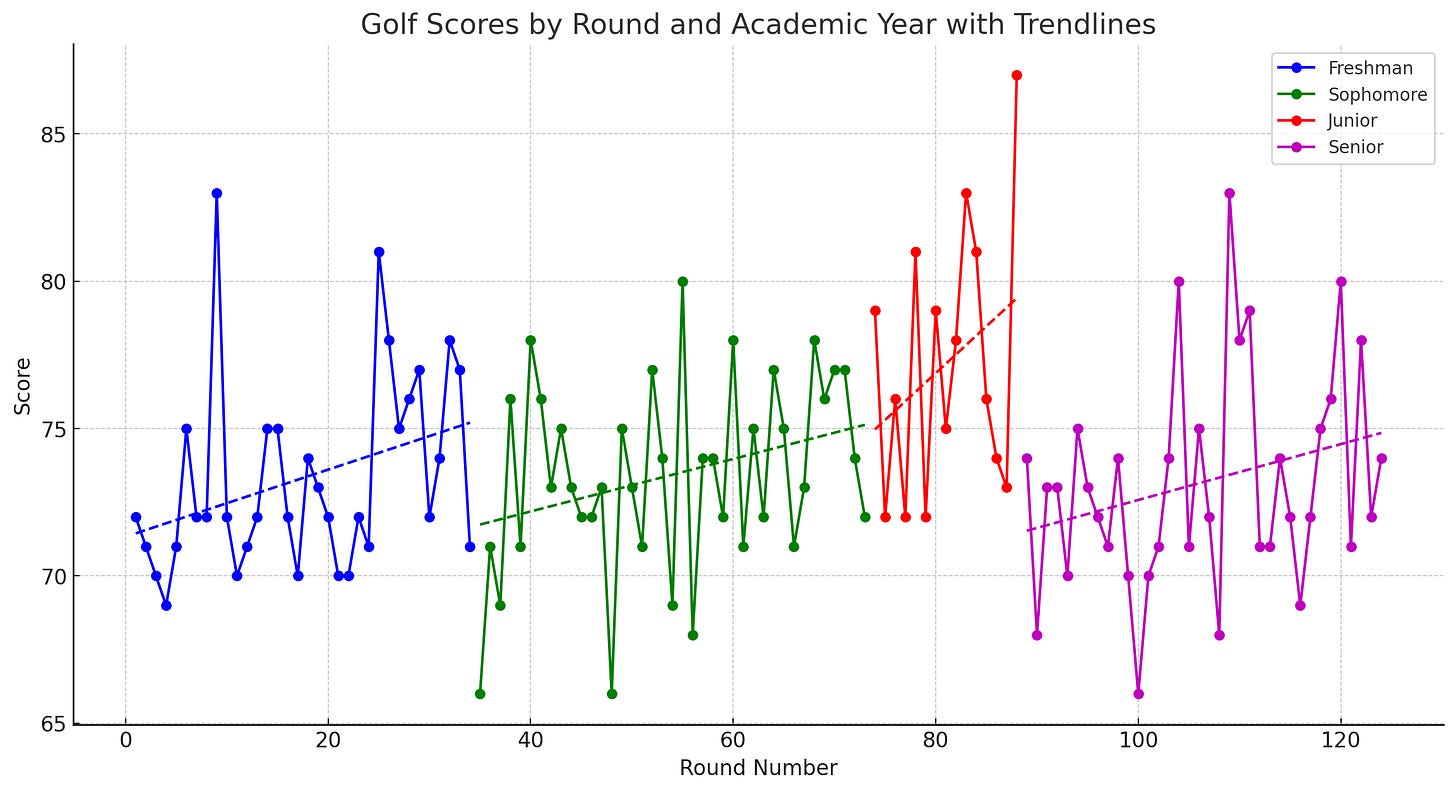
Not all collegiate tournaments are created equal. If we add a trendline to my scoring per academic year, an undesirable trend emerges:
Every year, my scoring increased as the year progressed. When coaches speak about “peaking for post-season,” these trend lines are not what we’re talking about.
However, there’s more nuance to the yearly scoring trend than what first meets the eye. I attended college in Texas. Although we traveled coast to coast across the United States for tournaments, most of our events were in the State of Texas. Spring golf in Texas is hard. Weather is usually chilly, very windy, and in general unpredictable. Some of this yearly scoring trend be explained by the seasonality of college golf.
Finally, let’s look at how my scoring per tournament round breaks down. In previous newsletters, we’ve seen how the first round scoring averages were consistently higher on both the AJGA as well as the Norwegian Junior Tour. We’ve also seen how the same trend did not emerge across NCAA DI Men’s Regional scoring averages over the past three years. I wonder if there are any patterns to my college career scoring:
Round 1: Average Score = 74.17 (41 occurrences)
Round 2: Average Score = 72.95 (41 occurrences)
Round 3: Average Score = 74.33 (40 occurrences)
Round 4: Average Score = 72.50 (2 occurrences)
First and third round averages are pretty similar. What stands out is the second round average. Of the 41 second rounds I played in college, 25 of them were played on the same day as the first round (meaning they were on 36-hole days). So in my case, it seems like the benefit to scoring of continuous play positively outweighed the negative effect of fatigue. I played better in the middle of the tournaments.
in my case, it seems like the benefit to scoring of continuous play positively outweighed the negative effect of fatigue.
That’s all I’ve got for this week. Next week, we’ll look at what a college career looks like for an elite player.
Please consider sharing this Substack directly with a few friends. It really helps this page out! Thank you!
If you’d like to support my work further, please consider becoming a paid subscriber. In addition to supporting my writing and website work, paid subscriber get access to all of the player development tools on www.mikkelgolf.com. The tools available include a library of performance drills and on-course formats, plus an on-course stats system designed to improve approach play and putting. Five division one golf programs currently use the stats portal. Reach out for more details if you’re interested!
Articles mentioned:
Evidence: The Importance of Patience in Golf
Let’s say you’ve decided you’re going to improve your putting. You tell yourself: “This is the year. I’m going to practice like a wild man, and sink every putt!” You envision your strokes gained putting skyrocketing as a result of what you think will be a one-to-one relationship between hours spent on the practice green and your make percentages.
First round scoring average in Junior and College Golf 🔢(MikkelGolf.com Newsletter #2)
Today, I wanted to share with you some interesting insights from the 2023 Srixon Tour in Norway (National Junior Tour). We’ll compare this to my anecdotal college data - and also look at the PGA Tour's scoring averages from the 2021-2022 season. To give some context: During my seven years as a Division 1 college coach, I've been tracking various golf sta…
First Round AJGA Scoring Averages 🧐
Last week we looked at the scoring averages on the Norwegian Junior Tour and compared them to the PGA Tour. We saw that the first round scoring averages on this junior tour were higher than the other rounds. This correlated to my observations from college golf as well. The PGA Tour scoring averages had smaller deviations round to round.


